cpu plugin
| Plugin name | cpu |
| Type | read |
| Callbacks | init, read |
| Status | supported |
| Since | 1.3 |
| Copyright | 2005–2009 Florian octo Forster, 2008 Oleg King, 2009 Simon Kuhnle, 2009 Manuel Sanmartin |
| License | GPLv2 |
| Configuration | collectd.conf(5) |
The CPU plugin collects the amount of time spent by the CPU in various states, most notably executing user code, executing system code, waiting for IO-operations and being idle.
This since has been an FAQ: The CPU plugin does not collect percentages. It collects “jiffies”, the units of scheduling. On many Linux systems there are circa 100 jiffies in one second, but this does not mean you will end up with a percentage. Depending on system load, hardware, whether or not the system is virtualized and possibly half a dozen other factors there may be more or less than 100 jiffies in one second. There is absolutely no guarantee that all states add up to 100, an absolute must for percentages.
Example graph
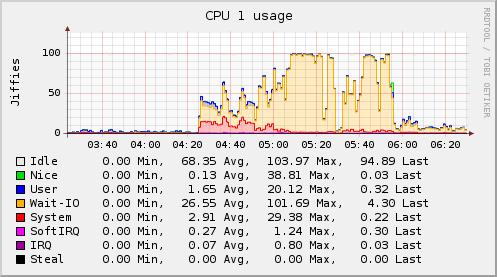 CPU utilization of a Linux machine.
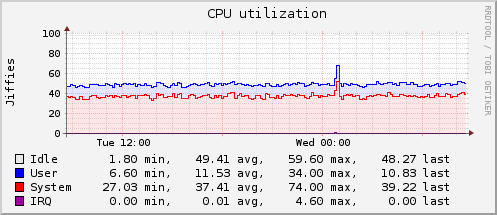 CPU utilization of a Windows machine.
Dependencies
- Linux
/proc-Filesystem
- Solaris
kstat_read(3KSTAT)
- OpenBSD
sysctl(3)
- FreeBSD
sysctlbyname(3)
- Mac OS X
- AIX
- libperfstat(3)
- Other
Caveats
DragonFly BSD and FreeBSD
On DragonFly BSD and old FreeBSD (before version 7), you may encounter this warning:
cpu: Only one processor supported when using sysctlbyname (found %d)
This warning tells you that you have more than one CPU, but that due to limitations in the interface used to read CPU usage information, only the grand total of all CPUs can be collected. Here, "Processor" is a processor as seen by the operating system, so it may actually refer to a "core".
History
The CPU plugin has been available since version 1.3.
Configuration
Configuration options · from collectd.conf(5)
See this section in the full configuration reference
The CPU plugin collects CPU usage metrics. By default, CPU usage is reported as Jiffies, using the cpu type. Two aggregations are available:
-
Sum, per-state, over all CPUs installed in the system; and
-
Sum, per-CPU, over all non-idle states of a CPU, creating an "active" state.
The two aggregations can be combined, leading to collectd only emitting a single "active" metric for the entire system. As soon as one of these aggregations (or both) is enabled, the cpu plugin will report a percentage, rather than Jiffies. In addition, you can request individual, per-state, per-CPU metrics to be reported as percentage.
The following configuration options are available:
- ReportByState true|false
- When set to true, the default, reports per-state metrics, e.g. "system", "user" and "idle". When set to false, aggregates (sums) all non-idle states into one "active" metric.
- ReportByCpu true|false
- When set to true, the default, reports per-CPU (per-core) metrics. When set to false, instead of reporting metrics for individual CPUs, only a global sum of CPU states is emitted.
- ValuesPercentage false|true
- This option is only considered when both, ReportByCpu and ReportByState are set to true. In this case, by default, metrics will be reported as Jiffies. By setting this option to true, you can request percentage values in the un-aggregated (per-CPU, per-state) mode as well.
- ReportNumCpu false|true
- When set to true, reports the number of available CPUs. Defaults to false.
- ReportGuestState false|true
- When set to true, reports the "guest" and "guest_nice" CPU states. Defaults to false.
- SubtractGuestState false|true
- This option is only considered when ReportGuestState is set to true. "guest" and "guest_nice" are included in respectively "user" and "nice". If set to true, "guest" will be subtracted from "user" and "guest_nice" will be subtracted from "nice". Defaults to true.