curl_json plugin
| Plugin name | curl_json |
| Type | read |
| Callbacks | config, read |
| Status | supported |
| Since | 4.8 |
| Copyright | 2009 Doug MacEachern, 2006–2009 Florian octo Forster |
| License | GPLv2 |
| Configuration | collectd.conf(5) |
The cURL-JSON plugin queries JavaScript Object Notation (JSON) data using the cURL library and parses it according to the user's configuration using Yet Another JSON Library (YAJL). This can be used to query statistics information from a CouchDB instance, for example. This plugin is a generic plugin, i.e. it cannot work without configuration, because there is no reasonable default behavior. Please read the Plugin curl_json section of the collectd.conf(5) manual page for an in-depth description of the plugin's configuration.
Synopsis
 <Plugin curl_json>
 # See: http://wiki.apache.org/couchdb/Runtime_Statistics
   <nowiki><URL "http://localhost:5984/_stats"></nowiki>
     Host "my_host"
     Instance "httpd"
     <Key "httpd/requests/count">
       Type "http_requests"
     </Key>

     <Key "httpd_request_methods/*/count">
       Type "http_request_methods"
     </Key>

     <Key "httpd_status_codes/*/count">
       Type "http_response_codes"
     </Key>
   </URL>
 # Database status metrics:
   <nowiki><URL "http://example.com:5984/_all_dbs"></nowiki>
     Host "other_host"
     Instance "dbs"
     <Key "*/doc_count">
       Type "gauge"
     </Key>
     <Key "*/doc_del_count">
       Type "counter"
     </Key>
     <Key "*/disk_size">
       Type "bytes"
     </Key>
   </URL>
 </Plugin>
Example graphs
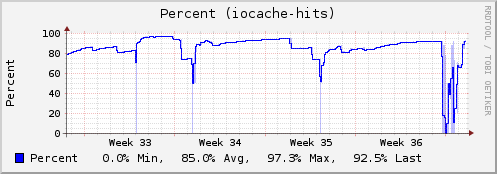
- Example above from Baptiste Mille-Mathias \<baptiste.millemathias@gmail.com> taken from the configuration example in Plugin-cURL-JSON/Cherokee
Usage examples
- Cherokee webserver
- Gathering php-fpm stats
- CouchDB statistics (this page)
- ArangoDB Nosql Database
Dependencies
- libcurl
- Yet Another JSON Library (yajl)
See also
Example: ArangoDB
This page contains some example configurations for the cURL-JSON plugin. This page is meant as a cookbook, so if you have a configuration for an aspect not handled here or a daemon not present, please feel free to add anything that's useful for you.
ArangoDB database
The ArangoDB database server exposes statistics in its Aardvark webinterface; We will use collecd to aggregate these values using the cURL-JSON plugin.
Add the following configuration to your collectd.conf.
 # collectd.conf
 TypesDB "/etc/collectd/collectd.conf.d/arangodb_types.db"
 TypesDB "/usr/share/collectd/types.db"
 LoadPlugin "curl_json"
 …
  <Plugin curl_json>
  # See: http://arangodb.org/
   <URL "http://localhost:8529/_db/_system/_admin/aardvark/statistics/short">
     # User "foo"
     # Password "bar"
     <Key "totalTimeDistributionPercent/values/0">
       Type "totalTimeDistributionPercent_values"
     </Key>
     <Key "totalTimeDistributionPercent/cuts/0">
       Type "totalTimeDistributionPercent_cuts"
     </Key>
     <Key "requestTimeDistributionPercent/values/0">
       Type "requestTimeDistributionPercent_values"
     </Key>
     <Key "requestTimeDistributionPercent/cuts/0">
       Type "requestTimeDistributionPercent_cuts"
     </Key>
     <Key "queueTimeDistributionPercent/values/0">
       Type "queueTimeDistributionPercent_values"
     </Key>
     <Key "queueTimeDistributionPercent/cuts/0">
       Type "queueTimeDistributionPercent_cuts"
     </Key>
     <Key "bytesSentDistributionPercent/values/0">
       Type "bytesSentDistributionPercent_values"
     </Key>
     <Key "bytesSentDistributionPercent/cuts/0">
       Type "bytesSentDistributionPercent_cuts"
     </Key>
     <Key "bytesReceivedDistributionPercent/values/0">
       Type "bytesReceivedDistributionPercent_values"
     </Key>
     <Key "bytesReceivedDistributionPercent/cuts/0">
       Type "bytesReceivedDistributionPercent_cuts"
     </Key>
     <Key "numberOfThreadsCurrent">
       Type "gauge"
     </Key>
     <Key "numberOfThreadsPercentChange">
       Type "gauge"
     </Key>
     <Key "virtualSizeCurrent">
       Type "gauge"
     </Key>
     <Key "virtualSizePercentChange">
       Type "gauge"
     </Key>
     <Key "residentSizeCurrent">
       Type "gauge"
     </Key>
     <Key "residentSizePercent">
       Type "gauge"
     </Key>
     <Key "asyncPerSecondCurrent">
       Type "gauge"
     </Key>
     <Key "asyncPerSecondPercentChange">
       Type "gauge"
     </Key>
     <Key "syncPerSecondCurrent">
       Type "gauge"
     </Key>
     <Key "syncPerSecondPercentChange">
       Type "gauge"
     </Key>
     <Key "clientConnectionsCurrent">
       Type "gauge"
     </Key>
     <Key "clientConnectionsPercentChange">
       Type "gauge"
     </Key>
     <Key "physicalMemory">
       Type "gauge"
     </Key>
     <Key "nextStart">
       Type "gauge"
     </Key>
     <Key "waitFor">
       Type "gauge"
     </Key>
     <Key "numberOfThreads15M">
       Type "gauge"
     </Key>
     <Key "numberOfThreads15MPercentChange">
       Type "gauge"
     </Key>
     <Key "virtualSize15M">
       Type "gauge"
     </Key>
     <Key "virtualSize15MPercentChange">
       Type "gauge"
     </Key>
     <Key "asyncPerSecond15M">
       Type "gauge"
     </Key>
     <Key "asyncPerSecond15MPercentChange">
       Type "gauge"
     </Key>
     <Key "syncPerSecond15M">
       Type "gauge"
     </Key>
     <Key "syncPerSecond15MPercentChange">
       Type "gauge"
     </Key>
     <Key "clientConnections15M">
       Type "gauge"
     </Key>
     <Key "clientConnections15MPercentChange">
       Type "gauge"
     </Key>
  </URL>
 </Plugin>
URLdefines the URL where arangod listens; if you use collectd on the same machine, the above specified host & port are ok for you.- Adjust (and uncomment) User & Password with a user to your ArangoDB.
We will create a custom types.db(5) (we configured it to /etc/collectd/collectd.conf.d/arangodb_types.db above) and add these types:
 totalTimeDistributionPercent_values        value:GAUGE:U:U
 totalTimeDistributionPercent_cuts      value:GAUGE:U:U
 requestTimeDistributionPercent_values      value:GAUGE:U:U
 requestTimeDistributionPercent_cuts        value:GAUGE:U:U
 queueTimeDistributionPercent_values        value:GAUGE:U:U
 queueTimeDistributionPercent_cuts      value:GAUGE:U:U
 bytesSentDistributionPercent_values        value:GAUGE:U:U
 bytesSentDistributionPercent_cuts      value:GAUGE:U:U
 bytesReceivedDistributionPercent_values        value:GAUGE:U:U
 bytesReceivedDistributionPercent_cuts      value:GAUGE:U:U
- requires at least collectd 5.4.2 to work.
References
- ArangoDB, the multi-model NoSQL database http://www.arangodb.com
Example: Cherokee
This page contains some example configurations for the cURL-JSON plugin. This page is meant as a cookbook, so if you have a configuration for an aspect not handled here or a daemon not present, please feel free to add anything that's useful for you.
Cherokee webserver
The Cherokee webserver exposes its statistics as JSON format which make easy to grab the values with collectd using the cURL-JSON plugin. This chapter will explain how to get information about traffic and connections from Cherokee. This is an extract of a small article I wrote on my website.
In my case I just monitor a limited set of values (traffic, numbers of connections and I/O cache), but there are a lot of information provided by this handler. \<hint>Feel free to expand the config below!\</hint>
In Cherokee, you need to enable the statistics interface. For that you'll need to activate the server info handler in a web directory; as this is beyond the scope of this example I suggest you to have a look at the documentation
Add the following configuration to your collectd.conf.
 # collectd.conf
 LoadPlugin "curl_json"
 …
 <Plugin "curl_json">
   <nowiki><URL "http://localhost/about/info/js"></nowiki>
    Instance "cherokee"

    <Key "traffic/tx">
      Type "httpd_bytes"
    </Key>

    <Key "traffic/rx">
      Type "httpd_bytes"
    </Key>

    <Key "connections/number">
      Type "httpd_connections"
    </Key>

    <Key "iocache/hits">
      Type "percent"
    </Key>
   </URL>
 </Plugin>
URL defines the URL used to retrieve the JSON data, so it is likely to change for you.
You'll need to create a custom types.db(5) and add these types:
 # types.db
 httpd_bytes             count:COUNTER:0:134217728
 httpd_connections       count:GAUGE:0:65535
 httpd_requests          count:COUNTER:0:134217728
Finally add the new types.db to the collectd configuration. Since this overrides the default, you need to explicitly configure the default types.db, too:
References
- Cheroke Webserver http://www.cherokee-project.com/
- Cherokee Server Info Handler http://www.cherokee-project.com/doc/modules_handlers_server_info.html
Example: PHP-FPM
This page contains some example configurations for the cURL-JSON plugin. This page is meant as a cookbook, so if you have a configuration for an aspect not handled here or a daemon not present, please feel free to add anything that's useful for you.
You can use cURL-JSON plugin plugin to collect stats from php-fpm instances. The example of config is below.
Config
 LoadPlugin curl_json
 <Plugin curl_json>
 <URL "http://127.0.0.1/_fpmstatus?json">
  Instance 'main'
  <Key "accepted conn">
      Type "phpfpm_requests"
      Instance ""
  </Key>
  <Key "slow requests">
      Type "phpfpm_slow_requests"
      Instance ""
  </Key>
  <Key "listen queue">
      Type "phpfpm_listen_queue"
      Instance ""
  </Key>
  <Key "active processes">
      Type "phpfpm_processes"
      Instance "active"
  </Key>
  <Key "total processes">
      Type "phpfpm_processes"
      Instance "total"
  </Key>
 </URL>
 </Plugin>
Please note that the metod used to access php-fpm stats is not FastCGI but HTTP. So you need to configure your web-server to pass such requests to php-fpm instance. You can check your web-server configuration using "curl". You had to get something similar to:
 #curl http://127.0.0.1/_fpmstatus?json
 {"pool":"pool_name","process manager":"dynamic","start time":1562671972,"start since":347271,"accepted conn":1082924,"listen queue":0,"max listen queue":0,"listen queue len":0,"idle processes":4,"active
 processes":1,"total processes":5,"max active processes":25,"max children reached":8,"slow requests":0}
Types
You'll need to create a custom types.db(5) and add these types:
 # types.db
 phpfpm_listen_queue  value:GAUGE:0:65535
 phpfpm_processes     value:GAUGE:0:65535
 phpfpm_requests      value:DERIVE:0:U
 phpfpm_slow_requests value:DERIVE:0:U
See TypesDB configuration option in collectd config file for locations of default and custom `types.db' files.
Example graphs
Configuration
Configuration options · from collectd.conf(5)
See this section in the full configuration reference
The curl_json plugin collects values from JSON data to be parsed by libyajl (https://lloyd.github.io/yajl/) retrieved via either libcurl (http://curl.haxx.se/) or read directly from a unix socket. The former can be used, for example, to collect values from CouchDB documents (which are stored JSON notation), and the latter to collect values from a uWSGI stats socket.
The following example will collect several values from the built-in _stats runtime statistics module of CouchDB (http://wiki.apache.org/couchdb/Runtime_Statistics).
<Plugin curl_json>
  <URL "http://localhost:5984/_stats">
    AddressFamily "any"
    Instance "httpd"
    <Key "httpd/requests/count">
      Type "http_requests"
    </Key>

<Key "httpd_request_methods/*/count">
  Type "http_request_methods"
</Key>

    <Key "httpd_status_codes/*/count">
      Type "http_response_codes"
    </Key>
  </URL>
</Plugin>
This example will collect data directly from a uWSGI "Stats Server" socket.
<Plugin curl_json>
  <Sock "/var/run/uwsgi.stats.sock">
    Instance "uwsgi"
    <Key "workers/*/requests">
      Type "http_requests"
    </Key>

    <Key "workers/*/apps/*/requests">
      Type "http_requests"
    </Key>
  </Sock>
</Plugin>
In the Plugin block, there may be one or more URL blocks, each defining a URL to be fetched via HTTP (using libcurl) or Sock blocks defining a unix socket to read JSON from directly. Each of these blocks may have one or more Key blocks.
The Key string argument must be in a path format. Each component is used to match the key from a JSON map or the index of an JSON array. If a path component of a Key is a * wildcard, the values for all map keys or array indices will be collectd.
The following options are valid within URL blocks:
- AddressFamily Type
- IP version to resolve URL to. Useful in cases when hostname in URL resolves to both IPv4 and IPv6 addresses, and you are interested in using one of them specifically. Use
ipv4to enforce IPv4,ipv6to enforce IPv6, oranyto keep the default behavior of resolving addresses to all IP versions your system allows. Iflibcurlis compiled without IPv6 support, usingipv6will result in a warning and fallback toany. IfTypecannot be parsed, a warning will be printed and the whole URL block will be ignored. - Host Name
- Use Name as the host name when submitting values. Defaults to the global host name setting.
- Plugin Plugin
- Use Plugin as the plugin name when submitting values. Defaults to
curl_json. - Instance Instance
- Sets the plugin instance to Instance.
- Interval Interval
- Sets the interval (in seconds) in which the values will be collected from this URL. By default the global Interval setting will be used.
- User Name
- Password Password
- Digest true|false
- VerifyPeer true|false
- VerifyHost true|false
- CACert file
- Header Header
- Post Body
- Timeout Milliseconds
- These options behave exactly equivalent to the appropriate options of the cURL plugin. Please see there for a detailed description.
- <StatisticsE<gt>
- One Statistics block can be used to specify cURL statistics to be collected for each request to the remote URL. See the section "cURL Statistics" above for details.
The following options are valid within Key blocks:
- Type Type
- Sets the type used to dispatch the values to the daemon. Detailed information about types and their configuration can be found in types.db(5). This option is mandatory.
- Instance Instance
- Type-instance to use. Defaults to the current map key or current string array element value.