tail plugin
| Plugin name | tail |
| Type | read |
| Callbacks | config, init, read, shutdown |
| Status | supported |
| Since | 4.4 |
| Copyright | 2008 Florian octo Forster |
| License | MIT License |
| Configuration | collectd.conf(5) |
Description
The Tail plugin can be used to “tail” log files, i. e. follow them as tail -F does. Each line is given to one or more “matches” which test if the line is relevant for any statistics using a POSIX extended regular expression. So you could, for example, count the number of failed login attempts via SSH by using the following regular expression with the /var/log/auth.log logfile:
\<sshd[^:]*: Invalid user [^ ]+ from\>
But counting lines that match is only the simplest application of this plugin. Take, for example, a daemon that writes the current number of users to a file periodically. You could collect this information with a regular expression like this:
There are currently (\d+) users
As you can see the actual number of users is stored in the first "sub match". This value can then be used by collectd as a gauge value.
And there's even more: Per default, Exim logs the size of each email in its logfile. You can match this size and add all the values up. So you'll end up with a typical octet-counter which you can use with the ipt_bytes type, for example. Such a regular expression would look like this:
\<S=(\d+)\>
This plugin is a generic plugin, i.e. it cannot work without configuration, because there is no reasonable default behavior. Please read the Plugin tail section of the collectd.conf(5) manual page for an in-depth description of the plugin's configuration.
“Following” files
To “follow” files, the Tail plugin does the following each interval:
- Read and handle each line of an already opened file descriptor until the end of the file is reached.
- Check if the file has been truncated. If so, seek to the beginning of the file and start processing the file from there.
- Retrieve the inode number associated with the file name that should be followed. This number is compared to the inode of the currently open file descriptor.
- If the inodes differ, the originally opened file has been moved or replaced. The file descriptor is closed and the file name is (re)opened.
- If no file had been open in step 1 (usually only true on the first iteration), open the file name, seek to the end but do not handle any lines.
To understand what's going on completely, you need to have a basic understanding of UNIX file systems. Especially: An inode is a number that determines the position of data on the disk (or whatever storage medium is in use). It's similar to an IP address, for example. A file name is basically a human readable name for an inode, similar to a domain name. A file descriptor is the representation of an opened file to a running program. To complete the analogy, it's similar to a TCP connection.
Once a file is opened (a file descriptor has been created), changes to the file name no longer affect the the running program directly. The file name can be removed or renamed, but since it is only an alias for an inode, the running program won't notice. By the way: This is why you have to notify some daemons when “rotating” the log file. collectd's LogFile plugin doesn't keep the file descriptor open, though. (Analogy: Once a TCP connection is established, changes to the DNS won't be noticed.)
Because changes to the file name aren't noticed automatically, the inode currently open is compared to the (newly looked up) inode the file name points to. If they differ, the file name now points to a new piece of data on the disk. We then assume that the file has been rotated, open the new file name and start reading from the beginning. (Analogy: Re-resolve the host name and compare IP addresses.)
Last but not least: In the previous interval, we have read to the end of the file. If the file has been shortened in the meantime, our file descriptor will now point to an undefined void somewhere after the file. We'll assume that the file has been truncated to length zero. Some daemons do this rather than change the file name and create a new file with the old name. The Tail plugin will therefore start processing this file from the beginning.
Synopsis
- → See: Plugin-Tail-Config
 <Plugin "tail">
  <File "/var/log/exim4/mainlog">
   Instance "exim"
   <Match>
    Regex "S=([1-9][0-9]*)"
    DSType "CounterAdd"
    Type "ipt_bytes"
    Instance "total"
   </Match>
   <Match>
    Regex "\\<R=local_user\\>"
    DSType "CounterInc"
    Type "counter"
    Instance "local_user"
   </Match>
  </File>
 </Plugin>
Example graphs
Invalid SSH login attempts
Number of failed SSH log-in attempts (per second) due to a wrong user names. As you can see in the graph, there's a brute-force attack going on with two tries per second.
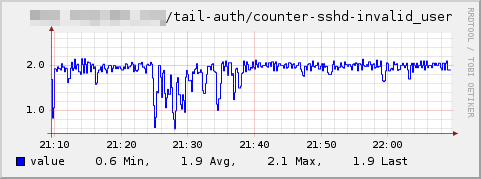
The configuration used when creating this graph was:
 <Plugin "tail">
   <File "/var/log/auth.log">
     Instance "auth"
     <Match>
       Regex "\\<sshd[^:]*: Invalid user [^ ]+ from\\>"
       DSType "CounterInc"
       Type "counter"
       Instance "sshd-invalid_user"
     </Match>
   </File>
 </Plugin>
Emails received for local recipients
Number of emails (per second) for local recipients, i. e. mail that is passed to a mail delivery agent (MDA). The graph shows about 3.5 hours of heavy spam activity. This graph is from a private box, for which four mails per second is a lot.
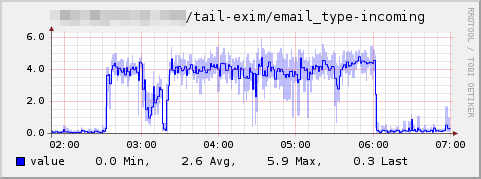
The configuration used when creating this graph was:
 <Plugin "tail">
   <File "/var/log/exim4/mainlog">
     Instance "exim"
     <Match>
       Regex "\\<R=local_user\\>"
       DSType "CounterInc"
       Type "email_type"
       Instance "incoming"
     </Match>
   </File>
 </Plugin>
Emails blocked by a real-time block list
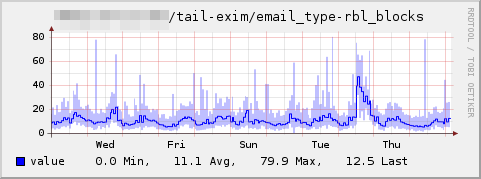
Number of emails rejected due to the sender's IP-address being contained in a real-time block list.
Dependencies
- none
See also
- Plugin-Tail-Config, example configurations for the Tail plugin.
Configuration examples
This page contains some example configurations for the Tail plugin. This page is meant as a cookbook, so if you have a configuration for an aspect not handled here or a daemon not present, please feel free to add anything that's useful for you.
Exim
Exim is a mail transfer agent (MTA) which is the default mail server in Debian.
The example config collects the rate of incoming and outgoing messages, bounces, deferred messages, IP connections and messages handled by a specific “router”.
 <File "/var/log/exim4/mainlog">
   Instance "exim"
   <Match>
     Regex "<="
     DSType "CounterInc"
     Type "email_type"
     Instance "incoming"
   </Match>
   <Match>
     Regex "=>"
     DSType "CounterInc"
     Type "email_type"
     Instance "outgoing"
   </Match>
   <Match>
     Regex "=="
     DSType "CounterInc"
     Type "email_type"
     Instance "defer"
   </Match>
   <Match>
     Regex "\\*\\*"
     DSType "CounterInc"
     Type "email_type"
     Instance "bounce"
   </Match>
   <Match>
     Regex "IP connection count = ([1-9][0-9]*)"
     DSType "GaugeAverage"
     Type "gauge"
     Instance "connection_count"
   </Match>
   <Match>
     Regex "Spam_checked  Spam-Score: ([5-9]|[1-9][0-9])"
     DSType "CounterInc"
     Type "email_type"
     Instance "saspam"
   </Match>
   <Match>
     Regex "R=virtdomain"
     DSType "CounterInc"
     Type "email_type"
     Instance "router-virtdomain"
   </Match>
   <Match>
     Regex "R=smarthost"
     DSType "CounterInc"
     Type "email_type"
     Instance "router-smarthost"
   </Match>
   <Match>
     Regex "R=dnslookup"
     DSType "CounterInc"
     Type "email_type"
     Instance "router-dnslookup"
   </Match>
   <Match>
     Regex "R=system_aliases"
     DSType "CounterInc"
     Type "email_type"
     Instance "router-system_aliases"
   </Match>
   <Match>
     Regex "R=fail"
     DSType "CounterInc"
     Type "email_type"
     Instance "router-fail"
   </Match>
 </File>
Postfix
Postfix is a mail transfer agent (MTA) which is widely used (e.g., used in large parts of the Debian infrastructure).
The example config collects the number of connections, rejected messages, various status codes, messages size, and queue delay information.
mail_counter is defined as value:DERIVE:0:U (see types.db(5) for details) and is used instead of counter to prevent counter overflows when restarting collectd.
 <File "/var/log/mail.log">
 # or: <File "/srv/rsyslog/mail.log">
   Instance "postfix"

   #Since 5.8, Collectd supports new options:
   #Plugin "postfix"
   #Instance "main"

    # number of connections
    # (incoming)
    <Match>
      Regex "\\<postfix\\/smtpd\\[[0-9]+\\]: connect from\\>"
      DSType "DeriveInc"
      Type "mail_counter"
      Instance "connection-in-open"
    </Match>
    <Match>
      Regex "\\<postfix\\/smtpd\\[[0-9]+\\]: disconnect from\\>"
      DSType "DeriveInc"
      Type "mail_counter"
      Instance "connection-in-close"
    </Match>
    <Match>
      Regex "\\<postfix\\/smtpd\\[[0-9]+\\]: lost connection after .* from\\>"
      DSType "DeriveInc"
      Type "mail_counter"
      Instance "connection-in-lost"
    </Match>
    <Match>
      Regex "\\<postfix\\/smtpd\\[[0-9]+\\]: timeout after .* from\\>"
      DSType "DeriveInc"
      Type "mail_counter"
      Instance "connection-in-timeout"
    </Match>
    <Match>
      Regex "\\<postfix\\/smtpd\\[[0-9]+\\]: setting up TLS connection from\\>"
      DSType "DeriveInc"
      Type "mail_counter"
      Instance "connection-in-TLS-setup"
    </Match>
    <Match>
      Regex "\\<postfix\\/smtpd\\[[0-9]+\\]: [A-Za-z]+ TLS connection established from\\>"
      DSType "DeriveInc"
      Type "mail_counter"
      Instance "connection-in-TLS-established"
    </Match>
    # (outgoing)
    <Match>
      Regex "\\<postfix\\/smtp\\[[0-9]+\\]: setting up TLS connection to\\>"
      DSType "DeriveInc"
      Type "mail_counter"
      Instance "connection-out-TLS-setup"
    </Match>
    <Match>
      Regex "\\<postfix\\/smtp\\[[0-9]+\\]: [A-Za-z]+ TLS connection established to\\>"
      DSType "DeriveInc"
      Type "mail_counter"
      Instance "connection-out-TLS-established"
    </Match>

   # rejects for incoming E-mails
   <Match>
     Regex "\\<554 5\\.7\\.1\\>"
     DSType "DeriveInc"
     Type "mail_counter"
     Instance "rejected"
   </Match>
   <Match>
     Regex "\\<450 4\\.7\\.1\\>.*Helo command rejected: Host not found\\>"
     DSType "DeriveInc"
     Type "mail_counter"
     Instance "rejected-host_not_found"
   </Match>
   <Match>
     Regex "\\<450 4\\.7\\.1\\>.*Client host rejected: No DNS entries for your MTA, HELO and Domain\\>"
     DSType "DeriveInc"
     Type "mail_counter"
     Instance "rejected-no_dns_entry"
   </Match>
    <Match>
      Regex "\\<450 4\\.7\\.1\\>.*Client host rejected: Mail appeared to be SPAM or forged\\>"
      DSType "DeriveInc"
      Type "mail_counter"
      Instance "rejected-spam_or_forged"
    </Match>

   # status codes
   <Match>
     Regex "status=deferred"
     DSType "DeriveInc"
     Type "mail_counter"
     Instance "status-deferred"
   </Match>
   <Match>
     Regex "status=forwarded"
     DSType "DeriveInc"
     Type "mail_counter"
     Instance "status-forwarded"
   </Match>
   <Match>
     Regex "status=reject"
     DSType "DeriveInc"
     Type "mail_counter"
     Instance "status-reject"
   </Match>
   <Match>
     Regex "status=sent"
     DSType "DeriveInc"
     Type "mail_counter"
     Instance "status-sent"
   </Match>
   <Match>
     Regex "status=bounced"
     DSType "DeriveInc"
     Type "mail_counter"
     Instance "status-bounced"
   </Match>
   <Match>
     Regex "status=SOFTBOUNCE"
     DSType "DeriveInc"
     Type "mail_counter"
     Instance "status-softbounce"
   </Match>

   # message size
   <Match>
     Regex "size=([0-9]*)"
     DSType "DeriveAdd"
     Type "ipt_bytes"
     Instance "size"
   </Match>

   # delays (see [http://serverfault.com/questions/24121/understanding-a-postfix-log-file-entry] for details)
   # total time spent in the Postfix queue
   <Match>
     Regex "delay=([\.0-9]*)"
     DSType "GaugeAverage"
     Type "gauge"
     Instance "delay"
   </Match>
   # time spent before the queue manager, including message transmission
   <Match>
     Regex "delays=([\.0-9]*)/[\.0-9]*/[\.0-9]*/[\.0-9]*"
     DSType "GaugeAverage"
     Type "gauge"
     Instance "delay-before_queue_mgr"
   </Match>
   # time spent in the queue manager
   <Match>
     Regex "delays=[\.0-9]*/([\.0-9]*)/[\.0-9]*/[\.0-9]*"
     DSType "GaugeAverage"
     Type "gauge"
     Instance "delay-in_queue_mgr"
   </Match>
   # connection setup time including DNS, HELO and TLS
   <Match>
     Regex "delays=[\.0-9]*/[\.0-9]*/([\.0-9]*)/[\.0-9]*"
     DSType "GaugeAverage"
     Type "gauge"
     Instance "delay-setup_time"
   </Match>
   # message transmission time
   <Match>
     Regex "delays=[\.0-9]*/[\.0-9]*/[\.0-9]*/([\.0-9]*)"
     DSType "GaugeAverage"
     Type "gauge"
     Instance "delay-trans_time"
   </Match>
 </File>
policyd-weight
policyd-weight is a policy daemon for the Postfix MTA.
The example config collects the number of messages rated unknown, accepted, deferred, and rejected.
 <File "/var/log/mail.log">
   Instance "policyd_weight"
   <Match>
     Regex "policyd-weight.*action=DUNNO\\>"
     DSType "CounterInc"
     Type "mail_counter"
     Instance "unknown"
   </Match>

   <Match>
     Regex "policyd-weight.*action=PREPEND\\>"
     DSType "CounterInc"
     Type "mail_counter"
     Instance "accepted"
   </Match>

   <Match>
     Regex "policyd-weight.*action=450\\>"
     DSType "CounterInc"
     Type "mail_counter"
     Instance "deferred"
   </Match>

   <Match>
     Regex "policyd-weight.*action=550\\>"
     DSType "CounterInc"
     Type "mail_counter"
     Instance "rejected"
   </Match>
 </File>
Postgrey
Postgrey is a Postfix policy server.
The sample config collects the number of messages that were greylisted, accepted (by the greylist), and accepted by whitelist.
 <File "/var/log/mail.log">
   Instance "postgrey"
   <Match>
     Regex "\\<action=greylist, reason=new\\>"
     DSType "CounterInc"
     Type "mail_counter"
     Instance "greylisted"
   </Match>

   <Match>
     Regex "\\<action=pass, reason=triplet found\\>"
     DSType "CounterInc"
     Type "mail_counter"
     Instance "accepted"
   </Match>

   <Match>
     Regex "\\<action=pass, reason=client whitelist\\>"
     DSType "CounterInc"
     Type "mail_counter"
     Instance "client_whitelist"
   </Match>
 </File>
Nginx
This sample collects records of HTTP errors 502 (Bad Gateway) and 504 (Gateway Timeout).
 <File "/var/log/nginx/nginx-error.log">
   Instance "nginx"
   <Match>
     Regex "\\(61: Connection refused\\)"
     DSType "DeriveInc"
     Type "derive"
     Instance "err_502"
   </Match>
   <Match>
     Regex "\\(60: Operation timed out\\)"
     DSType "DeriveInc"
     Type "derive"
     Instance "err_504"
   </Match>
 </File>
Type "derive" is used to avoid peaks when collectd is restarted.
Backend stats
This example shows how collectd can be used to collect request processing stats from your backend, such as response time and responses count. To make this example work on your system, you should add new log format to the nginx configuration and use that format to log requests to your backend (e.g. Apache and php-fpm).
  <Plugin "tail">
    <File "/var/log/nginx/apache-backend1.log">
      Instance backend1
      <Match>
        Regex ".*"
        DSType "DeriveInc"
        Type "nginx_requests"
        #Instance "requests"
      </Match>
      <Match>
        Regex "^\\S+ \"([0-9.]+)\""
        DSType "GaugeAverage"
        Type "response_time"
        Instance "AvgRespTime"
      </Match>
      <Match>
        Regex "^\\S+ \"([0-9.]+)\""
        DSType "GaugeMin"
        Type "response_time"
        Instance "MinRespTime"
      </Match>
      <Match>
        Regex "^\\S+ \"([0-9.]+)\""
        DSType "GaugeMax"
        Type "response_time"
        Instance "MaxRespTime"
      </Match>
      ##Since Collectd-5.7 there is Distribution DSType supported.
      <Match>
          Regex "^\\S+ \"([0-9.]+)\""
          Type "response_time"
          <DSType "Distribution">
            Percentile 10
            Percentile 30
            Percentile 50
            Percentile 70
            Percentile 90
            Percentile 95
            BucketType "http_rate"
            Bucket 0.000 0.100
            Bucket 0.100 0.200
            Bucket 0.200 0.500
            Bucket 0.500 1.000
            Bucket 1.000 2.000
            Bucket 2.000 5.000
            Bucket 5.000 0
          </DSType>
      </Match>
    </File>
  </Plugin>
Nginx config:
  http {
  ... other directives ...
        log_format  main  '[$host] "$upstream_response_time" '
           '$remote_addr - $remote_user [$time_local] $status '
           '"$request"  $body_bytes_sent "$http_referer" '
           '"$http_user_agent" "$upstream_addr"';
  ... other directives ...
  server {
    ...
    location / {
        ...
        access_log /var/log/nginx/apache-backend1.log main;
        access_log /var/log/nginx/site.example.com-access.log;
        proxy_pass/fastcgi_pass ...
        ...
    }
    location ~* \.(gif|jpg|jpeg|ico|js|css| ... )$ {
        #access_log off;
        access_log /var/log/nginx/site.example.com-access.log;
        try_files $uri $uri/  @backend;
    }
    location @backend {
        access_log /var/log/nginx/apache-backend1.log main;
        access_log /var/log/nginx/site.example.com-access.log;
        proxy_pass/fastcgi_pass ...
        ...
    }
    ... other locations and directives ...
  }
  ... other servers ...
  }
The log_format setting changes formatting to add $upstream_response_time as a second field to the logged line. This value is then picked up by the regex at in the Tail plugin configuration. In the nginx config above, requests to backend separated from requests to static files, so the regex ".*" at instance "requests" is acceptable. Two access_log directives are used to get a complete access log (with static and dynamic requests both).
Unfortunately, this example does not support requests which processed by several backends (step by step, by using nginx internal redirects, error handlers, etc). In that case, $upstream_response_time has several values, separated by commas and colons, which is not supported by the regular expression in this example.
You can tune this example for your needs, to get charts for $upstream_response_length, $request_length, $request_time, etc. Refer to ngx_http_upstream_module#variables and ngx_http_log_module.html#log_format for a list of available variables.
See also
Configuration
Configuration options · from collectd.conf(5)
See this section in the full configuration reference
The tail plugin follows logfiles, just like tail(1) does, parses each line and dispatches found values. What is matched can be configured by the user using (extended) regular expressions, as described in regex(7).
<Plugin "tail">
  <File "/var/log/exim4/mainlog">
    Plugin "mail"
    Instance "exim"
    Interval 60
    <Match>
      Regex "S=([1-9][0-9]*)"
      DSType "CounterAdd"
      Type "ipt_bytes"
      Instance "total"
    </Match>
    <Match>
      Regex "\\<R=local_user\\>"
      ExcludeRegex "\\<R=local_user\\>.*mail_spool defer"
      DSType "CounterInc"
      Type "counter"
      Instance "local_user"
    </Match>
    <Match>
      Regex "l=([0-9]*\\.[0-9]*)"
      <DSType "Distribution">
        Percentile 99
        Bucket 0 100
        #BucketType "bucket"
      </DSType>
      Type "latency"
      Instance "foo"
    </Match>
  </File>
</Plugin>
The config consists of one or more File blocks, each of which configures one logfile to parse. Within each File block, there are one or more Match blocks, which configure a regular expression to search for.
The Plugin and Instance options in the File block may be used to set the plugin name and instance respectively. So in the above example the plugin name mail-exim would be used.
These options are applied for all Match blocks that follow it, until the next Plugin or Instance option. This way you can extract several plugin instances from one logfile, handy when parsing syslog and the like.
The Interval option allows you to define the length of time between reads. If this is not set, the default Interval will be used.
Each Match block has the following options to describe how the match should be performed:
- Regex regex
-
Sets the regular expression to use for matching against a line. The first subexpression has to match something that can be turned into a number by
strtoll(3)orstrtod(3), depending on the value ofCounterAdd, see below. Because extended regular expressions are used, you do not need to use backslashes for subexpressions! If in doubt, please consultregex(7). Due to collectd's config parsing you need to escape backslashes, though. So if you want to match literal parentheses you need to do the following: - ExcludeRegex regex
-
Sets an optional regular expression to use for excluding lines from the match. An example which excludes all connections from localhost from the match:
- DSType Type
-
Sets how the values are cumulated. Type is one of:
- GaugeAverage
- Calculate the average of all values matched during the interval.
- GaugeMin
- Report the smallest value matched during the interval.
- GaugeMax
- Report the greatest value matched during the interval.
- GaugeLast
- Report the last value matched during the interval.
- GaugePersist
- Report the last matching value. The metric is not reset to
NaNat the end of an interval. It is continuously reported until another value is matched. This is intended for cases in which only state changes are reported, for example a thermometer that only reports the temperature when it changes. - CounterSet
- DeriveSet
- AbsoluteSet
- The matched number is a counter. Simply sets the internal counter to this value. Variants exist for
COUNTER,DERIVE, andABSOLUTEdata sources. - GaugeAdd
- CounterAdd
- DeriveAdd
- Add the matched value to the internal counter. In case of DeriveAdd, the matched number may be negative, which will effectively subtract from the internal counter.
- GaugeInc
- CounterInc
- DeriveInc
-
Increase the internal counter by one. These DSType are the only ones that do not use the matched subexpression, but simply count the number of matched lines. Thus, you may use a regular expression without submatch in this case.
GaugeInc is reset to zero after every read, unlike other Gauge* metrics which are reset to
NaN. - Distribution
-
Type to do calculations based on the distribution of values, primarily calculating percentiles. This is primarily geared towards latency, but can be used for other metrics as well. The range of values tracked with this setting must be in the range (0–2^34) and can be fractional. Please note that neither zero nor 2^34 are inclusive bounds, i.e. zero cannot be handled by a distribution.
This option must be used together with the Percentile and/or Bucket options.
Synopsis:
- Percentile Percent
-
Calculate and dispatch the configured percentile, i.e. compute the value, so that Percent of all matched values are smaller than or equal to the computed latency.
Metrics are reported with the type Type (the value of the above option) and the type instance
[<InstanceE<gt-]<PercentE<gt>>.This option may be repeated to calculate more than one percentile.
- Bucket lower_bound upper_bound
-
Export the number of values (a
DERIVE) falling within the given range. Both, lower_bound and upper_bound may be a fractional number, such as 0.5. Each Bucket option specifies an interval(lower_bound, upper_bound], i.e. the range excludes the lower bound and includes the upper bound. lower_bound and upper_bound may be zero, meaning no lower/upper bound.To export the entire (0–inf) range without overlap, use the upper bound of the previous range as the lower bound of the following range. In other words, use the following schema:
Metrics are reported with the type set by BucketType option (
bucketby default) and the type instance<TypeE<gt[-<InstanceE<gt>]-<lower_boundE<gt>_<upper_boundE<gt>>.This option may be repeated to calculate more than one rate.
- BucketType Type
- Sets the type used to dispatch Bucket metrics. Optional, by default
bucketwill be used.
The Gauge* and Distribution types interpret the submatch as a floating point number, using
strtod(3). The Counter* and AbsoluteSet types interpret the submatch as an unsigned integer usingstrtoull(3). The Derive* types interpret the submatch as a signed integer usingstrtoll(3). CounterInc, DeriveInc and GaugeInc do not use the submatch at all and it may be omitted in this case.The Gauge* types, unless noted otherwise, are reset to
NaNafter being reported. In other words, GaugeAverage reports the average of all values matched since the last metric was reported (orNaNif there was no match). - Type Type
- Sets the type used to dispatch this value. Detailed information about types and their configuration can be found in types.db(5).
- Instance TypeInstance
- This optional setting sets the type instance to use.