intel_pmu plugin
| Plugin name | intel_pmu |
| Type | read |
| Callbacks | config, init, read, shutdown |
| Status | supported |
| Since | 5.8 |
| Copyright | 2017–2018 Intel Corporation |
| Configuration | collectd.conf(5) |
The intel_pmu plugin collects information provided by Linux perf interface which provides rich generalized abstractions over hardware specific capabilities. All events are reported on a per core basis.
Performance counters are CPU hardware registers that count hardware events such as instructions executed, cache-misses suffered, or branches mispredicted. They form a basis for profiling applications to trace dynamic control flow and identify hotspots.
For a full description of available options please refer to the collectd.conf(5) manual page.
Synopsis
- → See: Plugin-Intel-PMU-Config
 <Plugin intel_pmu>
    ReportHardwareCacheEvents true
    ReportKernelPMUEvents true
    ReportSoftwareEvents true
    EventList "/var/cache/pmu/GenuineIntel-6-2D-core.json"
    HardwareEvents "L2_RQSTS.CODE_RD_HIT,L2_RQSTS.CODE_RD_MISS" "L2_RQSTS.ALL_CODE_RD"
    Cores "0" "1,35" "[12-17]"
    DispatchMultiPmu false
  </Plugin>
For a full description of available options please refer to the collectd.conf(5) manual page.
Parameters
| Name | Description | Comment |
|---|---|---|
| Interval | The interval within which to retrieve statistics on monitored events in seconds | Interval option is supported by collectd and is defined in |
| ReportHardwareCacheEvents | Enable/disable monitoring of hardware cache events | |
| ReportKernelPMUEvents | Enable/disable monitoring of kernel PMU events | |
| ReportSoftwareEvents | Enable/disable monitoring of software vents | |
| EventList | Path to hardware events list file for current CPU. | File can be downloaded by event_download.py script which is part of pmu-tools package. |
| HardwareEvents | String containing comma separated list of hardware specific events to monitor | |
| Cores | Core groups definition. Monitored metrics are reported only for configured cores. If this option is omitted all available cores are monitored. If a group is enclosed in square brackets each core is added individually to a separate group (that is statistics are not aggregated). | Allowed formats: "0,1,2,3" "0-3" "[0-3]" |
| DispatchMultiPmu | Enable/disable dispatching of cloned multi PMU for uncore events. If disabled only total sum is dispatched as single event. If enabled separate metric is dispatched for every counter. | Allowed values: true or false Uncore event example: UNC_CHA_DIR_LOOKUP.NO_SNP. If enabled information about event type is added to type_instance, e.g.: "UNC_CHA_DIR_LOOKUP.NO_SNP:type=30". It allows to distinguish between multiple counters for one event. |
Metrics
|
|
|
|
|
|
|
|
|---|---|---|---|---|---|---|---|
|
|
|
|
|
|
|
|
|
|
|
|
|
|
|
|
|
|
|
|
|
|
|
|
|
|
|
|
|
|
|
|
|
|
|
|
|
|
|
|
|
|
|
|
|
|
|
|
|
|
|
|
|
|
|
|
|
|
|
|
|
|
|
|
|
|
|
|
|
|
|
|
|
|
|
|
|
|
|
|
|
|
|
|
|
|
|
|
|
|
|
|
|
|
|
|
|
|
|
|
|
|
|
|
|
|
|
|
|
|
|
|
|
|
|
|
|
|
|
|
|
|
|
|
|
|
|
|
|
|
|
|
|
|
|
|
|
|
|
|
|
|
|
|
|
|
|
|
|
|
|
|
|
|
|
|
|
|
|
|
|
|
|
|
|
|
|
|
|
|
|
|
|
|
|
|
|
|
|
|
|
|
|
|
|
|
|
|
|
|
|
|
|
|
|
|
|
|
|
|
|
|
|
|
|
|
|
|
|
|
|
|
|
|
|
|
|
|
|
|
|
|
|
|
|
|
|
|
|
|
|
|
|
|
|
|
|
|
|
|
|
|
|
|
|
|
|
|
|
|
|
|
|
|
|
|
|
|
|
|
|
|
|
|
|
|
|
|
|
|
|
|
|
|
|
|
|
|
|
|
|
|
|
|
|
|
|
|
|
|
|
|
|
|
|
|
|
|
|
|
|
|
|
|
|
|
|
|
|
|
|
|
|
|
|
|
|
|
|
|
|
|
|
|
|
|
|
|
|
|
|
|
|
|
|
|
|
|
|
|
|
|
|
|
|
|
|
|
|
|
|
|
|
|
|
|
|
|
|
|
|
|
|
|
|
|
|
|
|
|
|
|
|
|
|
|
|
|
|
|
|
|
|
|
|
|
|
|
|
|
|
|
Example graph
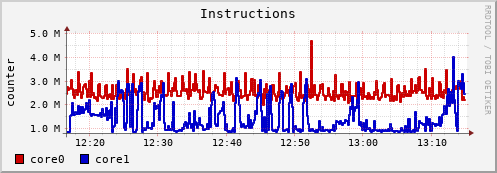
Instructions (counter) corresponding to perf metric PERF_COUNT_HW_INSTRUCTIONS.
History
- Cores option is available since release 5.8.1.
- Support for uncore multi pmu was added in 5.11
Dependencies
See also
- Plugin-Intel-PMU-Tests
- PMU plugin high level design document
Configuration examples
This page contains some example configurations for the Intel PMU plugin. This page is meant as a cookbook, so if you have a configuration for an aspect not handled here or a daemon not present, please feel free to add anything that's useful for you.
Collect only HWCacheEvents
Collect only KernelPMUevents
Collect only SWEvents
Enable hardware specific events
A single value or comma separated list of values should be used for HWSpecificEvents parameter.
 <Plugin intel_pmu>
  HWCacheEvents false
  KernelPMUEvents false
  SWEvents false
  HWSpecificEvents "L2_RQSTS.CODE_RD_HIT,L2_RQSTS.CODE_RD_MISS"
 </Plugin>
See also
Configuration
Configuration options · from collectd.conf(5)
See this section in the full configuration reference
The intel_pmu plugin collects performance counters data on Intel CPUs using Linux perf interface. All events are reported on a per core basis.
Synopsis:
<Plugin intel_pmu>
  ReportHardwareCacheEvents true
  ReportKernelPMUEvents true
  ReportSoftwareEvents true
  EventList "/var/cache/pmu/GenuineIntel-6-2D-core.json"
  HardwareEvents "L2_RQSTS.CODE_RD_HIT,L2_RQSTS.CODE_RD_MISS" "L2_RQSTS.ALL_CODE_RD"
  Cores "0-3" "4,6" "[12-15]"
  DispatchMultiPmu false
</Plugin>
Options:
- ReportHardwareCacheEvents false|true
- Enable or disable measuring of hardware CPU cache events: - L1-dcache-loads - L1-dcache-load-misses - L1-dcache-stores - L1-dcache-store-misses - L1-dcache-prefetches - L1-dcache-prefetch-misses - L1-icache-loads - L1-icache-load-misses - L1-icache-prefetches - L1-icache-prefetch-misses - LLC-loads - LLC-load-misses - LLC-stores - LLC-store-misses - LLC-prefetches - LLC-prefetch-misses - dTLB-loads - dTLB-load-misses - dTLB-stores - dTLB-store-misses - dTLB-prefetches - dTLB-prefetch-misses - iTLB-loads - iTLB-load-misses - branch-loads - branch-load-misses
- ReportKernelPMUEvents false|true
- Enable or disable measuring of the following events: - cpu-cycles - instructions - cache-references - cache-misses - branches - branch-misses - bus-cycles
- ReportSoftwareEvents false|true
- Enable or disable measuring of software events provided by kernel: - cpu-clock - task-clock - context-switches - cpu-migrations - page-faults - minor-faults - major-faults - alignment-faults - emulation-faults
- EventList filename
- JSON performance counter event list file name. To be able to monitor all Intel CPU specific events JSON event list file should be downloaded. Use the pmu-tools event_download.py script to download event list for current CPU.
- HardwareEvents events
- This field is a list of event names or groups of comma separated event names. This option requires EventList option to be configured.
- Cores cores groups
-
All events are reported on a per core basis. Monitoring of the events can be configured for a group of cores (aggregated statistics). This field defines groups of cores on which to monitor supported events. The field is represented as list of strings with core group values. Each string represents a list of cores in a group. If a group is enclosed in square brackets each core is added individually to a separate group (that is statistics are not aggregated). Allowed formats are: 0,1,2,3 0-10,20-18 1,3,5-8,10,0x10-12 [4-15,32-63]
If an empty string is provided as value for this field default cores configuration is applied - that is separate group is created for each core.
- DispatchMultiPmu false|true
- Enable or disable dispatching of cloned multi PMU for uncore events. If disabled only total sum is dispatched as single event. If enabled separate metric is dispatched for every counter.