processes plugin
| Plugin name | processes |
| Type | read |
| Callbacks | config, init, read |
| Status | supported |
| Since | 3.2 |
| Copyright | 2005 Lyonel Vincent, 2006–2008 Florian octo Forster, 2008 Oleg King, 2009 Sebastian Harl, 2009 Andrés J. Díaz, 2009 Manuel Sanmartin, 2010 Clément Stenac |
| Configuration | collectd.conf(5) |
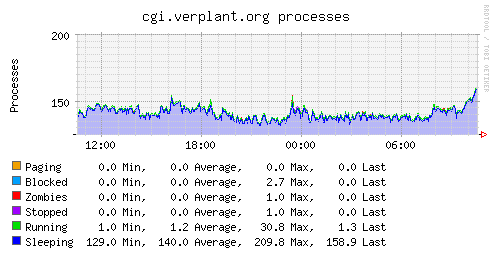
The Processes plugin collects the number of processes, grouped by their state (e. g. running, sleeping, zombies, etc.). In addition to that, it can select detailed statistics about selected processes, grouped by name.
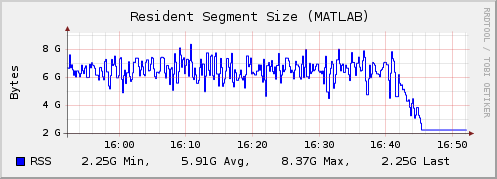
If processes are selected (the collectd.conf(5) manpage can tell you how) the following information is gathered. All this information is aggregated by the process name.
- Its Resident Segment Size (RSS; basically the amount of physical memory currently used by these processes)
- Used user- and system-time (the "CPU usage")
- The number of processes by that name
- The number of threads (summed up over all the processes)
- The number of open files (Linux only) (Since version-5.8)
- The number of memory mapped files (Linux only) (Since version-5.8)
- The rate of context switches (Linux only)
- The rate of major and minor page faults.
- Rough I/O-numbers (bytes written and read due to syscalls by the process). (Since version-4.9)
Example Graphs
Dependencies
- Linux, Solaris
/proc-file system
- FreeBSD, Mac OS X
- libkvm
- AIX
<procinfo.h>
Configuration
Configuration options · from collectd.conf(5)
See this section in the full configuration reference
Collects information about processes of local system.
By default, with no process matches configured, only general statistics is collected: the number of processes in each state and fork rate.
Process matches can be configured by Process and ProcessMatch options. These may also be a block in which further options may be specified.
The statistics collected for matched processes are: - size of the resident segment size (RSS) - user- and system-time used - number of processes - number of threads - number of open files (under Linux) - number of memory mapped files (under Linux) - io data (where available) - context switches (under Linux) - minor and major pagefaults - Delay Accounting information (Linux only, requires libmnl)
Synopsis:
<Plugin processes>
  CollectFileDescriptor  true
  CollectContextSwitch   true
  CollectDelayAccounting false
  Process "name"
  ProcessMatch "name" "regex"
  <Process "collectd">
    CollectFileDescriptor  false
    CollectContextSwitch   false
    CollectDelayAccounting true
  </Process>
  <ProcessMatch "name" "regex">
    CollectFileDescriptor false
    CollectContextSwitch true
  </ProcessMatch>
</Plugin>
- Process Name
-
Select more detailed statistics of processes matching this name.
Some platforms have a limit on the length of process names. Name must stay below this limit.
- ProcessMatch name regex
- Select more detailed statistics of processes matching the specified regex (see
regex(7)for details). The statistics of all matching processes are summed up and dispatched to the daemon using the specified name as an identifier. This allows one to "group" several processes together. name must not contain slashes. - CollectContextSwitch Boolean
- Collect the number of context switches for matched processes. Disabled by default.
- CollectDelayAccounting Boolean
-
If enabled, collect Linux Delay Accounding information for matching processes. Delay Accounting provides the time processes wait for the CPU to become available, for I/O operations to finish, for pages to be swapped in and for freed pages to be reclaimed. The metrics are reported as "seconds per second" using the
delay_ratetype, e.g.delay_rate-delay-cpu. Disabled by default.This option is only available on Linux, requires the
libmnllibrary and requires theCAP_NET_ADMINcapability at runtime. - CollectFileDescriptor Boolean
- Collect number of file descriptors of matched processes. Disabled by default.
- CollectMemoryMaps Boolean
- Collect the number of memory mapped files of the process. The limit for this number is configured via
/proc/sys/vm/max_map_countin the Linux kernel.
The CollectContextSwitch, CollectDelayAccounting, CollectFileDescriptor and CollectMemoryMaps options may be used inside Process and ProcessMatch blocks. When used there, these options affect reporting the corresponding processes only. Outside of Process and ProcessMatch blocks these options set the default value for subsequent matches.